

This month, Demand Metric released a Brightcove-sponsored report on interactive video, with participation from our interactive video partners and customers. This report offers a high-level overview of the current definitions, adoption, applications, and effectiveness of interactive video. The following blog post from one of the participating partners shares deeper insight into topics discussed in the report.
When TouchCast launched in mid-2013, we believed that interactive video’s moment had arrived. Our hypothesis was that as video moved to the center of the Internet experience, as touchscreens became ubiquitous, and as link sharing became a shorthand form of communication, viewers would simply expect video to be as clickable as the rest of the web. After all, once you had clicked on a graphical element inside a video and witnessed something magical, inspiring, or useful happening - we predicted - then you would want to click on everything in all video screcasens, all the time. In fact, when you clicked on a video screen - whether a navigation system in your car or that big piece of glass in your living room - and nothing happened, then that flat experience would feel broken and unsatisfying.
USAGE
We launched our company based on that hypothesis, and now we have data. Specifically, TouchCast’s consumer software has been downloaded over a million times, and dozens of large companies have deployed our commercial, Enterprise version. Tens of thousands of video authors have produced over a hundred thousand interactive videos, generating millions of interactive video views and many millions more screen taps and mouse clicks. Our analytics software tracks every single click, and we know exactly what our viewers click on, when and where on the screen, precise to the pixel, accurate to each frame of video.
PERFORMANCE
And what we know so far about viewer engagement with interactive video is that viewers tap or click on interactive video applications at remarkably high interaction rates.
During one recent twelve-month period, TouchCast tracked viewer interactions with tens of thousands of videos produced with our authoring software. Among teachers and students who used our “freemium” education application, 72% of viewers clicked on at least one video application. In separate analyses, among employees of our Fortune 500 Enterprise clients, 46% of viewers clicked on at least one video application. Among our Media & Entertainment publisher clients, 34% of their audiences tapped or clicked on an interactive application at least once. These are broad averages across a wide variety of genres and creative executions. Some of our more progressive media publishers regularly see interaction rates of 50% or greater, with some individual performances in the 70%-80% range.
Interactive video is still very much an emerging medium, where metrics and standards are only just taking shape. It’s likely that different providers measure different user behaviours slightly differently. Furthermore, when compared to the incumbent video behemoths, the viewing volumes we’re measuring are still relatively small. Still, by any standard, the viewer behaviour we’re measuring is striking. In a digital ecosystem where user participation rates in the low single digits are the norm, interaction rates for interactive video are at least an order of magnitude higher.
Below is a graph showing User Interaction with the video applications in a TouchCast interactive video, in this case produced by the BBC. The overall shape of this graph is pretty typical of what we see across all formats and genres.
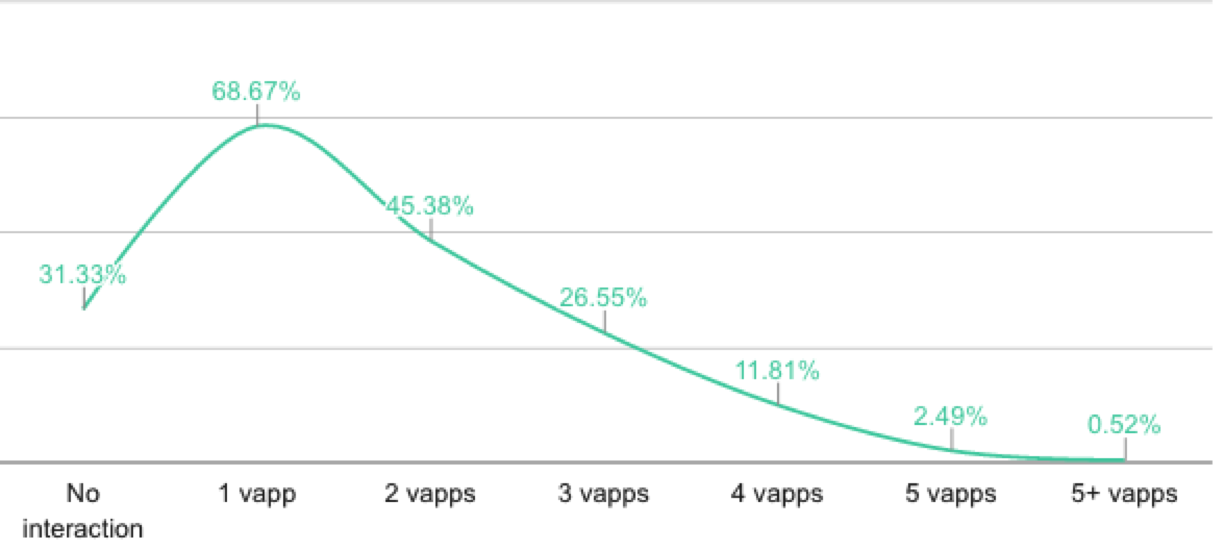
This particular video is 2:19 in length, and it contains six interactive video applications. When the viewer tapped or clicked, three of the “vApps” opened up related short video segments; two opened up still images, and the final vApp was a poll that invited viewers to vote.
The graph shows that among viewers who started the video:
- 31% took no action beyond watching the video in a linear fashion
- almost 70% of viewers clicked on at least one interactive application
- 45% of viewers clicked on at least two interactive applications
- 27% clicked on three interactive applications
- 2.5% of all viewers clicked on at least 5 interactive video applications.
For typical, consumer marketing campaigns - whether digital or traditional - the benchmark for success is between 1-2% response rates for a single action. With interactive video, ~ 2.5% of viewers take at least five actions. Indeed, we’re disappointed when we see a TouchCast campaign that delivers an interaction rate of “only” 20% (that is, 20% of viewers clicked on at least one video application.) Then we remind ourselves that even a mid-range interactive video delivery is still at least 10 times greater than what other media formats deliver!
REASONS FOR HIGH ENGAGEMENT RATES
One thing we now know to be true - and true in an empirical, statistically valid way - is that interactive video is an inherently engaging medium. On further reflection, even though the interaction rates are eye-popping, this should come as no surprise. Interactive videos are inherently engaging because they have purposefully been built to be engaging.
To understand why this is true, instead of thinking of interactive video as only the province of branching or non-linear narratives, think of it as a container of other media files, like a Dropbox folder. And instead of thinking of the presenter’s narration as a scripted performance, think of it as their visual annotation to all of the delightful things in their container.
Now, a teacher has used TouchCast to create a “flipped classroom” lesson plan, and her container is full of reading material and classroom assignments. A marketer has put a technical white paper inside a video blog post, much like in an earlier era he would have put charts and graphs in a slide deck. A reporter has stuffed his or her container full of even more facts and context, whether the subject is trainspotting, Broadway show tunes, or the Back Street Boys. You click because either you are required to (in the case of homework, corporate training, or internal communication) or because you want to (in the case of marketing, or narrative subjects that deeply interest you.)
One other thing we’ve noticed: any individual video’s interaction rate and overall user interaction “curve” (what percentage of viewers clicked once, what percentage clicked twice, etc.) are established very early in its publication lifecycle. Often it only takes a couple of hundred views before we see an enduring user interaction pattern emerge. Thereafter, even if the viewership grows by a factor of ten, or even a hundredfold, the interaction rate rarely changes by more than a percentage point or two. That means there is something specific to the way an interactive video is created that makes the good ones that much more engaging than the mediocre ones. So what makes a good interactive video? We’ve now got plenty of data to tell us, and more blog posts to write in the future.
Get the interactive video report!