
Today, Brightcove and TubeMogul released the Online Video & the Media Industry Quarterly Research Report for the first and second quarters of 2011. The report examines online video discovery, usage, and engagement data from a sample of thousands of websites covering newspapers, magazines, online media, broadcasters, and brands. In addition to the quarterly data, this report takes a special look at engagement on mobile devices.
Key findings for the first half of 2011, include:
Platform Usage
- All media industry categories saw solid growth in video streams in Q1 and Q2, with magazine publishers experiencing the most pronounced growth at 56.34%.
- Streams grew 355% for online media between Q4 and Q1, while broadcasters saw a 140% increase over the same period.
.png)
Engagement
- Magazines, newspapers and online media publishers all saw a 7-11% increase in average minutes watched per view between Q1 and Q2.
- Broadcasters had the highest overall average minutes watched per view in Q1 and Q2, followed by brand marketers.
- For broadcasters, full-length episodes garnered significantly higher completion rates than shorter-form clips, with more than 70% watching more than 75% of the video and 64% watching through the credits to the end.
- Google saw an increase in referred video traffic of 3.7% between quarters, while Facebook and Twitter continued to lead in average minutes watched per view by discovery source.
- American and European viewers watched broadcast videos the longest per view, while viewers in the Asia-Pacific region watched about the same amount for broadcast and newspaper content.
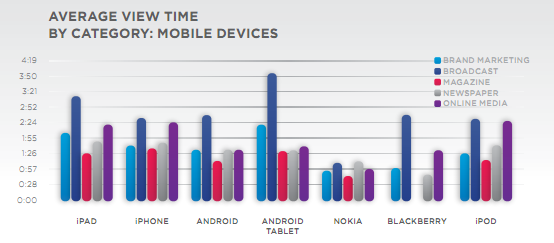
Special Feature: Mobile Engagement
- Nearly half the amount of total mobile minutes viewed came from Android devices (49%); iPhone and iPad devices combined held 48%.
- On average, Android tablet users watched 55 seconds longer per view than other mobile devices. That's 1:28 longer for broadcast and an average of 53 seconds longer for brand marketers.
Methodology
The data used for the analysis included in this report was taken from an anonymous, cross-section sample of Brightcove customers representing media industry segments and brands. While the sample aggregates a sizable data set, it is not intended to be statistically representative of the online video industry as a whole, or of Brightcove’s entire customer base. Instead, the data analysis is intended to provide a directional snapshot of media trends and inform additional research initiatives focused on the online video industry. Any findings, opinions, or conclusions expressed here are those of the author(s) and are based solely on the aggregated data sample.
This research report draws on a number of data sources:
- Platform data from an anonymous and random sample of Brightcove media customers; and
- Consumer engagement reports based on TubeMogul’s online video analytics from this aggregate data set.