
 Today Brightcove and TubeMogul released the Online Video & the Media Industry Quarterly Research Report for the fourth quarter of 2010. The report examines online video discovery, usage, and engagement data from a sample of nearly 2,000 websites covering newspapers, magazines, online media, broadcasters, and brands. In addition to the quarterly data, this report takes a look at the year in review.
Platform Usage
- Broadcasters led in total minutes streamed in 2010. Broadcasters also regained their top position in total minutes streamed, beating out newspapers, who peaked last quarter.
- Newspapers saw huge growth (147% quarter over quarter) in number of titles uploaded for the second quarter in a row, which suggest that news organizations continue to embrace video to present multimedia news stories.
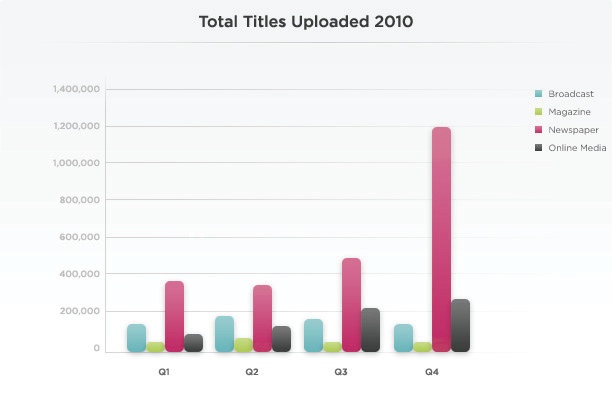
- Newspapers also had the highest number of player loads across all categories for the year, suggesting that newspapers have video players across more pages and have more total page views than other media categories.
Engagement
- Engagement rates trended upward quarter over quarter across all media categories. Audiences watched longer on average than in previous months, which is a good indication of the increasing consumer adoption and comfort with watching online video.
- Brands saw a massive 98% jump in engagement this quarter, reaching 2:03 minutes on average compared to 1:03 minutes watched the prior quarter. This suggests that brands are improving the quality of their content and connecting with receptive audiences.
- Completion rates trended upward across the board, which is not surprising given that minutes viewed also trended upwards.
- As a referral source, Facebook and Twitter accounted for the highest engagement rates across all media categories. Brands saw highest video engagement when referred by Yahoo!, which may point to the success of syndication efforts of such content.
- Broadcast content viewers from the United States had the highest minutes watched per view (3:53) with European viewers close behind (3:34).
Download the report now.
Methodology
The data used for the analysis included in this report was taken from an anonymous, cross-section sample of Brightcove customers representing media industry segments and brands. While the sample aggregates a sizable data set, it is not intended to be statistically representative of the online video industry as a whole, or of Brightcove’s entire customer base. Instead, the data analysis is intended to provide a directional snapshot of media trends and inform additional research initiatives focused on the online video industry. Any findings, opinions, or conclusions expressed here are those of the author(s) and are based solely on the aggregated data sample.
This research report draws on a number of data sources:
- Platform data from an anonymous and random sample of Brightcove media customers; and
- Consumer engagement reports based on TubeMogul’s online video analytics from this aggregate data set.