
Today Brightcove and TubeMogul released the Online Video & the Media Industry Quarterly Research Report for the third quarter of 2010. The report examines online video discovery, usage, and engagement data from a sample of nearly 2,000 news and entertainment websites.
In Q3, we also included a special feature focusing on the peak days of the week and times of day broken out by each of the media industries we cover.
Notable findings include:
Discovery
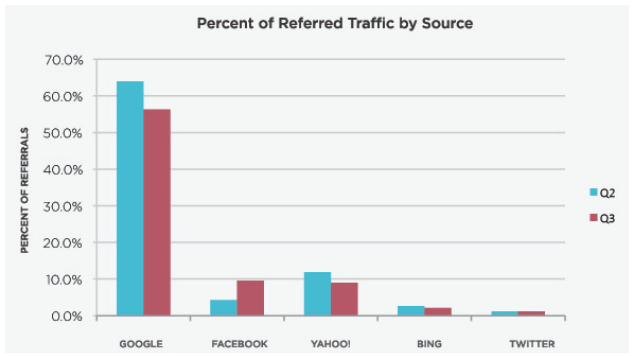
- Facebook now refers more video streams than Yahoo! for the aggregate media sample. This marks the first time the social platform has surpassed the search engine and content portal. Facebook accounted for 9.6% of all referrals, making it second only to Google.
Online Video Streams
- Newspapers saw significant growth in the number of titles uploaded (51% growth) and surpassed broadcasters in total minutes streamed for the first time this quarter. This is an interesting development, and suggests that newspapers are rapidly adopting and producing video content for what was once a print business. This data also bears out the distinct differences in the content between the two verticals: broadcasters have fewer but longer titles, while newspapers are producing many more, but shorter titles on a more regular basis.
- Online media properties (which includes pure-play Web properties and blogs) also had a strong growth quarter in player loads (127% growth) and titles uploaded (23% growth), suggesting that video adoption and production activity is on the rise across the growing media category.
Engagement
- Completion rates for brand marketers (47%), broadcasters (44%), and online media properties (45.9%) continued to rise quarter to quarter, reaching new highs in Q3.
- Gaming consoles lead in average viewing time, suggesting that lean-back environments are the most engaged of the three screens. This is also the first time we’ve broken out cross-device engagement metrics for this report and will be followed by detailed analysis by device next quarter.
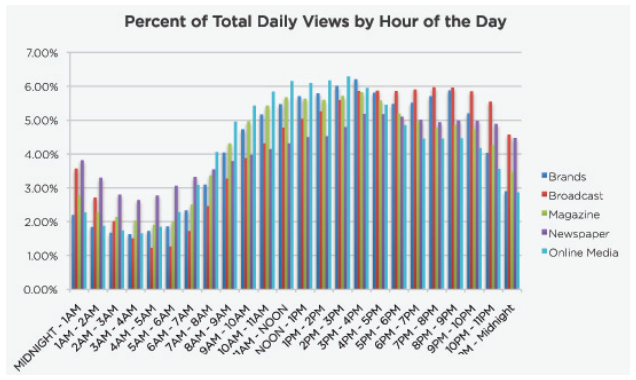
Special Feature: Video Activity by the Hour and the Day
- The most active days of the week by total video views for all media companies were weekdays, in particular peaking on Wednesdays. By category, brand marketers and online media saw peaks in total views on Thursdays.
- In contrast, the weekends including Friday had the highest engagement per view based on average minutes watched across the aggregate sample.
- “Prime time” online video watching behavior for media categories varied greatly depending on the category. Magazines and online media peaked during working hours, while newspapers had more steady engagement into the evening hours. And, as expected, broadcasters total daily views peaked during traditional “prime time” hours from 6-11PM, mirroring their television counterparts.
Download the full report. Or check out prior quarters' reports and other white papers.
Methodology
The data used for the analysis included in this report was taken from an anonymous, aggregated cross-section sample of Brightcove customers representing media industry verticals. While the sample aggregates a sizable data set, it is not intended to be statistically representative of the online video industry as a whole, or of Brightcove’s entire customer base. Instead, the data analysis is intended to provide a directional snapshot of media trends and inform additional research initiatives focused on the online video industry. Any findings, opinions, or conclusions expressed here are those of the authors(s) and are based solely on the aggregated data sample.